Find the content worth repeating
Content Performance & Topic Analyzer
Compare your posts by topic or format. See the typical result, the spread and the evidence behind each group before planning your next batch.
A typical result, not one lucky post
Which topics keep delivering?
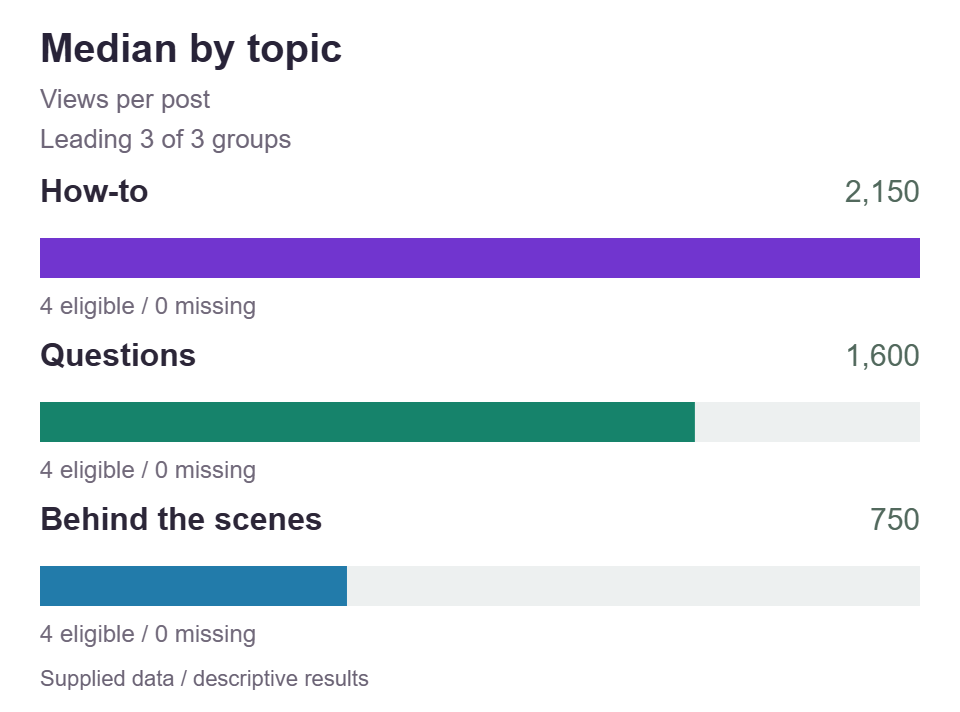
Fictional 12-post dataset. The chart uses this analyzer’s actual medians, not a prediction or customer result.
Compare the work, not the guess
Find a useful pattern in your posts
Keep one account and a matching observation age in each dataset. An unknown count is different from a measured zero.
Your comparison
The age is a declaration, not a correction to your numbers. Counts from different post ages or audiences may not be comparable.
Add a post
Blank = unknown. Enter a count only when you have it.
Up to 120 rows and 1 MiB. The template includes fictional example rows; replace them with your own. Native exports need these headers and counts, not an automatic connector.
Your content evidence
No analysis yet.
| Group | Posts | Median | Mean | Range | Index |
|---|
Index 100 = the eligible dataset median. Higher is not automatically better for your business. Display numbers are rounded; exports retain the numeric results.
The minimum-post setting is a review threshold, not statistical significance. Below-threshold groups stay visible. Group differences do not prove that a topic or format caused the result.
Your supplied posts
0 of 120 posts
| Post ID | Topic | Format | Actions |
|---|
Your data stays in this page. No account connection, upload, API or autosave. Save a project before leaving. Project, copied review, CSV and PDF attachments include all supplied labels and numbers, even rows outside the current filters. The PDF shows all groups and a counted post subset; its attachments preserve the complete dataset. Ordinary site resources still load.
How the comparison is built
One scope. Clear groups. Visible evidence.
Keep the inputs comparable
Choose one account, traffic scope and observation age. Missing counts stay unknown.
Compare typical post results
Group by topic or format, then inspect the median, mean, range and eligible sample.
Choose a question to test
Keep small groups visible, check the spread and plan a specific follow-up comparison.
Start with a decision about content, not a score
A content performance review should help you decide what deserves another careful test. Perhaps your team has published practical instructions, customer stories, and product explanations, but the next production slot is still being chosen by memory. Comparing those groups makes the discussion more concrete. This analyzer groups the post records you supply by topic or format and describes their results for one selected objective. It does not grade the writing, inspect the pictures, or explain why a post received attention. The useful output is a clearer question for the next round of work, not a universal winner or an automatic publishing plan.
Consider a fictional craft supplier called Paperbridge Kits. Its editor wants to decide whether next month needs more setup instructions or more project diaries. The review contains six organic posts from one Facebook Page, observed at a declared age of 168 hours. The chosen objective is clicks because the immediate question concerns movement toward supporting pages, not applause in the feed. Setup posts have supplied click counts of 12, 18, and 30. Project diaries have 6, 9, and 12. These invented numbers make the method easy to follow; they are not a benchmark for craft accounts or Facebook generally.
Write the decision in ordinary language before entering records: “Which topic should receive three more comparable posts in our next review?” That wording leaves room for uncertainty and production judgment. It is different from asking for the best publishing hour or combining every interaction into an engagement percentage. Use the separate Best Time to Post Analyzer for a timestamp question. Here, keep attention on what the posts cover and how they present it. A topic with modest numbers may still fill an essential customer need, so the comparison should inform editorial choices without replacing them.
Declare one comparable context before adding posts
Every project has one platform, one account label, one observation age, and one traffic declaration. Choose that scope before collecting a convenient mixture of numbers. An account label identifies the dataset for your team; it is not a username lookup or proof of ownership. Observation age describes the shared age you intend the supplied counts to represent, expressed in hours. Setting 168 hours does not turn a two day snapshot into a seven day snapshot. The tool neither checks publication dates nor normalizes older results. You are responsible for collecting counts that make the declaration a reasonable description of the review.
Paperbridge records each selected post after approximately the same planned observation interval and keeps collection details in its own working record. A new post collected after only 24 hours stays out of this particular comparison until an appropriate snapshot is available. The editor does not multiply its clicks by seven to invent a mature count. A post that received promotion also needs attention: the traffic setting applies to the project, not independently to each row. Separate organic and paid collections when the question requires that distinction. Choosing mixed honestly labels a blend, but it does not remove the different exposure conditions.
Keep native definitions alongside your collection process. Views, impressions, clicks, and reach can have different meanings across platforms, account surfaces, formats, and reporting periods. Selecting a platform here provides context; it does not convert definitions into a shared measurement standard. Do not combine two accounts simply because both exports use the word reach. Do not add post reach figures to claim a unique audience, since the same account or person may appear across posts. If you need several platform reviews, save separate projects and compare the written observations cautiously rather than inventing one cross-platform audience total from unrelated rows.
Build a small, reliable post inventory
Give every record a unique post ID, one topic label, and one format label. An ID can be a short reference that lets your team find the original record outside the tool; it does not trigger a fetch. Topic describes the subject or recurring audience problem, while format describes the presentation. “Setup” and “Project diary” are topics in the fictional review; “Video” and “Image” would be formats. Avoid changing those meanings halfway through entry. The project accepts up to 120 posts, with up to twelve distinct topics and twelve formats, so use a vocabulary that is detailed enough to guide an actual decision.
Quick entry is useful for a short review because you can add records deliberately and inspect them as you go. Supply any known values among reach, impressions, views, likes, comments, shares, saves, and clicks. Each row needs at least one supplied count, but it need not contain every metric. Enter whole nonnegative counts without separators or shorthand. A known zero means the recorded count was zero. An empty count means it is missing. Those two states lead to different coverage results, so do not fill empty boxes with zero merely to make the inventory look complete or to remove an inconvenient warning.
For a larger collection, use the supplied CSV template and preserve its exact column names. This is a specific input format, not a promise to recognize every native platform export. Paste prepared CSV and press Replace dataset to apply that text. Alternatively, Open CSV reads a chosen file and applies its validated rows after any replacement confirmation; do not press Replace dataset again for that file. Either route retains the current project context, so check the account and observation age afterward. Save a useful existing project before replacing it. JSON keeps the whole editable project, including settings; the review CSV serves a different purpose and is not a lossless project backup.
Choose an objective whose units answer the question
A raw count objective compares the number supplied for each post. Choosing clicks asks about clicks per post, while choosing comments asks about comments per post. It does not silently adjust for reach or impressions. Raw counts are often a sensible first view when the team needs to understand the volume associated with its usual production. They also reflect differences in exposure, promotion, audience conditions, and observation practices. Paperbridge starts with clicks because its question is about the typical supplied click count for each topic. It will review exposure separately before deciding whether the difference deserves more production time or a narrower follow-up.
Three rate objectives offer explicit denominators: saves per reach, shares per reach, and clicks per impressions. Each eligible post is calculated separately as 100 times its numerator divided by its denominator. For example, 24 clicks with 1200 impressions produce 2 clicks per 100 impressions. That is an action rate, not proof that two percent of distinct people visited a page. Repeated displays and actions may be involved, and the source definition of clicks still matters. A known numerator and a positive known denominator are required. A missing denominator or a denominator of zero cannot produce a usable rate for that post.
The group median for a rate objective comes from those individual post rates, not from adding all numerators and dividing by all denominators. Suppose two posts have 1 save from reach 50 and 30 saves from reach 1000. Their rates are 2 and 3 saves per 100 reach, giving a median of 2.5. Pooling the counts would give about 2.95, which answers a different question and is not the method here. Use the Engagement Rate Calculator for a separate engagement calculation when appropriate. Do not relabel this analyzer’s single-action rates as a combined engagement or unique-person conversion score.
Read medians, means, ranges, and the baseline together
The median is the middle eligible post value after sorting; with an even number of values, it is the average of the two middle values. The mean adds the values and divides by the eligible post count. Minimum and maximum show the observed endpoints, not an expected future interval. These views belong together because a group can look strong in one summary and uneven in another. In Paperbridge’s setup group, 12, 18, and 30 clicks give a median of 18, a mean of 20, and a range from 12 to 30. The larger result pulls the mean above the median.
The diary values of 6, 9, and 12 have a median and mean of 9, with endpoints 6 and 12. Across all six eligible posts, the sorted values are 6, 9, 12, 12, 18, and 30. The dataset median is therefore 12 and its mean is 14.5. The index compares each group median with that dataset median, using the baseline as 100. Setup has an index of 150 and diaries an index of 75. These are relative descriptions of the supplied collection, not grades out of 100, industry rankings, or predictions of the next post’s result.
An index of 150 means the group median is one and a half times the current dataset median. It does not mean a 150 percent improvement, and it does not show that the topic caused anything. If the baseline median is zero, the index is unavailable rather than an enormous invented number. Sorting places higher group medians first, but inspect coverage before reading the first row as a priority. When two groups share a median, their order is not evidence that one is superior. Look at the values, eligible counts, missing counts, and practical role of each group before writing a conclusion.
Use filters to ask a narrower, honest question
The topic and format filters select the rows included before statistics are calculated. That changes the dataset baseline as well as the group results. If you compare topics while selecting only Video, your question becomes a topic comparison within the supplied video rows. If you compare formats while selecting Setup, your question becomes a format comparison within that topic. These can be useful follow-ups to a broad result, but they are different reviews. Keep their settings with the conclusions. An index calculated against one filtered collection should not be compared casually with an index from another collection as though both used an unchanged reference.
Suppose Paperbridge discovers that every setup post was a video and every diary was an image. The original difference cannot separate subject from presentation. There are no setup images or diary videos available to make those narrower comparisons. The tool cannot manufacture the missing combinations, match audiences, or adjust away this imbalance. A useful next step is to produce both presentations for both topics in a future round and review the resulting records. One group is allowed, but it provides a descriptive summary rather than a genuine comparison between alternatives. A warning about that limitation is information to keep, not an obstacle to work around.
Choose a minimum post threshold that encourages your team to notice thin groups. The supported setting runs from two to twenty, and groups below it remain visible with a flag. This is a user-chosen review threshold, not a test of statistical significance or a guarantee of reliability. With a threshold of four, both three-post groups in the fictional example deserve a small-sample note. Changing the threshold to three removes that particular flag without adding a single observation. Likewise, filtering until only favorable posts remain changes the question rather than strengthening the evidence. Record why a narrower scope is relevant before using it to make a decision.
Turn the review into a concrete editorial experiment
Write a short observation that includes the objective, scope, and uncertainty. For Paperbridge, a fair statement is: “In six supplied organic posts at our declared 168 hour observation age, setup posts had a median of 18 clicks and diaries had 9, with three eligible posts in each group.” Then add the important caveat that topic and format were aligned in this collection. This is more useful than saying setup content is twice as effective. The second phrase hides the small collection, the presentation imbalance, and the fact that clicks alone do not establish customer usefulness, purchases, or satisfaction.
Choose one follow-up that the team can actually produce. Paperbridge plans six additional posts: three setup explanations and three diaries, each using the same presentation format for this round. The editor keeps the traffic declaration and collection routine consistent and chooses clicks before seeing the results. The production note also identifies what counts as a setup explanation, so weaker results do not get relabeled later. This is a practical observational follow-up, not a randomized experiment or a guarantee that every other influence is controlled. The analyzer does not generate that plan automatically; the team chooses it after reading the supplied evidence.
Keep production effort and essential coverage in the conversation without pretending they are fields in this tool. If a setup video takes four hours and a diary image takes one, a raw click comparison alone cannot decide the production budget. Record those costs separately and discuss whether the extra work serves the business question. A lower-volume topic may answer a frequent support problem or explain a necessary limitation. Use the Content Hub Planner when the next task is organizing related website resources. Do not ask a descriptive post comparison to stand in for a complete content strategy or customer research program.
Save the evidence and make the next review repeatable
Use Save to keep an editable JSON project and Open to return to that saved work. There is no autosave or account-backed project library, so an open browser tab is not the record you should rely on. After an edit, analyze again before using results or exports; the previous review no longer represents the current dataset. A blank collection can be kept as a draft, while a result export needs at least one eligible post for the chosen objective. Name saved files so the account, collection round, and objective are understandable outside the tab, and retain your original collection notes separately.
Copy, CSV, and PDF are review outputs rather than native platform reports. The review retains settings, method, and limitations alongside the calculated comparison. The PDF includes the raw project JSON and full review CSV as attachments. Filters do not remove the other supplied rows from those retained records, so review the entire dataset before sharing any export. An apparently narrow chart can travel with information outside its visible scope. Use neutral IDs and account labels where possible, and remember that local processing does not make a downloaded file harmless to distribute. Only share counts and labels that the recipient should actually receive.
Finish with a handoff that another editor can repeat: the saved project, the selected objective, the observation routine, a plain observation, and one next question. At the next review, inspect new coverage and ranges before comparing headline medians. Keep separate rounds separate if their contexts differ materially, rather than quietly replacing history with a more flattering collection. SMTasker can support broader account routines outside this browser-only analysis, but this tool does not import its findings into an automation or publish the next test. Its job ends with a transparent comparison that leaves the reasoning visible and the editorial decision with your team.
Make the comparison fit the work
Platform and practical guides
Use the right counts, group labels and interpretation for your content.
Instagram Content Performance
Compare Instagram themes with a consistent post age and the metric that matches your content goal.
Read the guideTikTok Content Performance
Separate repeatable video topics from the effect of one unusually large view count.
Read the guideYouTube Content Performance
Review video topics without equating Shorts, long videos and unrelated measurement windows.
Read the guideFacebook Content Performance
Compare community content with the same account, traffic scope and observation age.
Read the guideLinkedIn Content Performance
Review professional topics and formats without confusing impressions with business outcomes.
Read the guideThreads Content Performance
Find useful patterns in supplied conversation and content counts from one Threads account.
Read the guideX Content Performance
Compare X topics and formats while keeping reply, view and click definitions clear.
Read the guideSnapchat Content Performance
Review Snapchat topics with supplied counts while keeping Stories and Spotlight in separate comparisons.
Read the guideReddit Content Performance
Use known post counts without treating net score as a count of positive votes.
Read the guideContent Pillar Analysis
Build a useful set of content-pillar labels and interpret the evidence behind each one.
Read the guideCompare Content Formats
Compare formats within a fair topic and observation scope before changing your production plan.
Read the guideQuestions about content performance analysis
Does this analyzer connect to my social account?
No. You supply post labels and counts through quick entry or the tool CSV template. The platform and account settings describe your project; they do not fetch, verify, or refresh analytics.
Does observation age adjust older posts automatically?
No. It is your declared shared observation age. The analyzer has no publication timestamps and cannot verify or normalize the ages represented by your supplied counts.
Why is a post excluded from a rate comparison?
A rate needs its numerator and a positive denominator. Missing counts or a zero denominator prevent that rate from being calculated. A known zero numerator with a positive denominator is eligible.
Is the index a content quality score?
No. It is the group median divided by the current dataset median, multiplied by 100. It is unavailable when the baseline median is zero and says nothing about quality or causality.
Does filtering remove other rows from the exported record?
No. Review exports preserve the raw project rows, including rows outside the filters. The PDF attaches project JSON and full review CSV, so inspect all supplied data before sharing.
From an observation to consistent work
Keep your account workflow moving
Use SMTasker for supported account automation around your approved content plan. Keep collection, interpretation, and review ownership with your team.