Review the moments, not a guess
Video Retention & Drop-off Analyzer
See where your supplied retention points change. Compare two video curves, separate the largest drop from the fastest decline, and build a focused editing review.
A clear interval to review
Find the change. Review the footage.
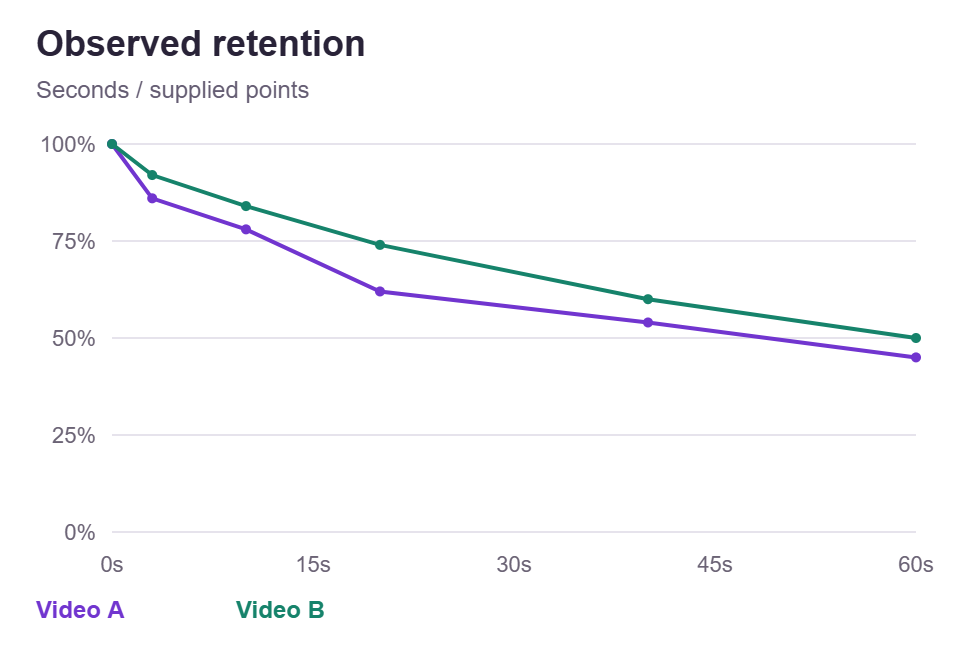
Fictional 60-second example. Video A drops 16 percentage points from 10 to 20 seconds. The curve identifies an interval to inspect, not the reason people left.
Work with actual observations
Map the moments worth a closer look
Bring timestamp percentages from your reporting source. An average watch time alone cannot reveal a retention curve.
Your video observations
Observed pattern
Dots are supplied points. Connecting lines are visual guides, not measured values between them. Purple = Video A; green = Video B.
No automatic lookup, uploaded video or invented benchmark. Review the same reporting scope and definition before interpreting a difference.
Your supplied values are processed in this browser, without a social login or upload. There is no autosave. Saved projects, review CSV, copied results and PDF attachments include both video slots, even if Video B is disabled. Check private labels and notes before sharing. A review CSV is not the input template; use project JSON to reopen the full draft.
How the review is built
Real points. Clear intervals. A practical next step.
Start with measured points
Keep the timestamp, percentage and reporting definition together. Missing moments stay unknown.
Separate size from speed
Inspect percentage-point changes and the length of each measured interval.
Plan a focused edit review
Check the footage around the interval, write a hypothesis and compare a new matched example.
Start with a review question that points can answer
A retention chart becomes useful when it supports a specific production question. You might need to inspect the passage between a demonstration and its explanation, compare two introductions, or check whether your final supplied observation actually reaches the video’s end. This analyzer organizes timestamp and retention percentage pairs so those questions have visible evidence. It describes changes between observations rather than diagnosing the video. It cannot hear a confusing sentence, identify a scene transition, or tell whether a viewer accomplished their task. Begin with an interval you want to understand, then keep the creative explanation separate from the arithmetic that prompted your review.
Choose Platform, enter an Account label, and describe the collection in Reporting scope. A useful scope might say that both videos use the same reporting period, traffic selection, and audience segment. These are declarations for the reviewer, not settings that retrieve or reconcile native analytics. Selecting YouTube, TikTok, Instagram, Facebook, LinkedIn, or X gives the project context only. Point availability and definitions differ across reporting surfaces. If your accessible records contain only total views, an average, or completion milestones with another denominator, you do not yet have the timestamp retention series this tool requires for an honest curve review.
Decide what action the review could reasonably inform before collecting favorable numbers. For an opening question, the video hook retention guide develops a narrowly chosen experiment. For an instructional upload with several destinations, use the YouTube audience retention guide to examine chapters and sparse opening observations. Neither approach turns descriptive differences into a controlled test. Your decision might be to collect more points, inspect a passage manually, or leave a useful explanation intact. A good review can end with uncertainty when the supplied evidence does not isolate a sensible production change for the next recording.
Prepare timestamp points without inventing a native import
For Video A, give Video label a recognizable reference and enter the real Duration (seconds). Timestamp points (CSV) accepts two exact, unique headers: time_seconds and retention_percent, in either order. Each following record needs a numeric timestamp and percentage; do not paste a native report and expect its columns to be mapped automatically. CSV template provides a fictional six-point starting example, not a connector to a platform. Replace those invented observations with your own authorized data before drawing conclusions. Average watch (seconds, optional) and Review notes are separate fields, so neither belongs as an extra input CSV column.
Use decimal seconds rather than a clock label such as 01:20, and provide plain decimal numbers without thousands separators, percent signs, or exponent notation. The tool accepts up to 240 points per video, with timestamp precision of three decimal places and percentage precision of two. It sorts timestamps, but duplicate times are rejected rather than averaged. Every time must fall within that video’s duration. These validation boundaries are tool limits, not promises about native reporting precision or platform policy. If two readings disagree at the same timestamp, resolve their source or scope yourself instead of hiding the conflict inside a duplicate row.
Paste prepared records into Timestamp points (CSV), or use Open CSV for the corresponding video and confirm replacement when requested. A rejected or cancelled import preserves the draft. Analyze retention uses the current pasted points, while Save project can preserve an unfinished draft without manufacturing observations. Analysis needs at least two valid points for each enabled video. Do not add a fictional zero-second value of 100 merely to satisfy that requirement. The LinkedIn retention guide addresses limited available data, and the X video retention guide explains why milestone reports need careful definition checks before any point preparation.
Work through the fictional sixty-second comparison
Load example supplies an invented pair of sixty-second videos to make the calculations inspectable. Video A has observations at 0, 3, 10, 20, 40, and 60 seconds, with percentages of 100, 86, 78, 62, 54, and 45. Its separately supplied average watch is 32 seconds. Video B uses the same timestamps with percentages of 100, 92, 84, 74, 60, and 50, alongside an average watch of 36 seconds. These are teaching values, not a client result, a randomized experiment, or a suggested target for any platform. Their matching timestamps simply make the comparison easier to audit by hand.
Across Video A’s first observed interval, the percentage changes from 100 to 86, a drop of fourteen percentage points over three seconds. Between ten and twenty seconds it changes from 78 to 62, a sixteen-point drop over ten seconds. The latter is the larger total observed drop, even though the opening interval falls faster per second. At the actual duration timestamp, Video A’s supplied endpoint is 45 percent and Video B’s is 50 percent. That endpoint comparison does not establish how many unique people finished either video, because the analyzer has no person-level playback histories or independently verified native counting rules.
Set Review window to Start (seconds) 0 and End (seconds) 10 for the example. Video A changes from 100 to 78, giving a twenty-two-point drop; Video B changes from 100 to 84, giving sixteen points. Video B therefore shows six fewer percentage points of decline across this particular observed window. The phrasing matters: this is not a six percent improvement in content quality or proof that an opening caused better attention. Keep the fictional scope attached to any demonstration screenshot or exported report. Replacing the example labels without replacing its numbers would still leave invented data, not an account analysis.
Distinguish the largest drop from the fastest decline
For neighboring supplied points, drop equals the earlier retention percentage minus the later percentage. Its unit is percentage points. Moving from 80 percent to 60 percent is a twenty-point drop, not a twenty percent relative loss. A relative calculation would answer another question and is not reported here. Interval rate divides that point change by elapsed seconds. Video A’s opening rate is fourteen divided by three, approximately 4.67 percentage points per second, while its ten-to-twenty-second rate is sixteen divided by ten, or 1.6. Both calculations describe their whole observed intervals; neither locates a sudden event inside one.
The largest drop highlights the greatest positive point difference between neighboring observations. The steepest drop highlights the greatest positive decline per second. These can select different passages because their durations differ. A long, gently declining explanation might lose more points overall than a brief transition, while the brief transition has the faster average decline. Read both with the interval boundaries visible. Ranking by total drop alone can overemphasize long gaps; ranking only by rate can direct attention toward tiny intervals with very limited context. Neither ranking is a measure of the production effort needed to improve a passage or its importance to the audience.
The review ranks up to six positive-drop intervals and separately identifies observed rises. Flat intervals and rises do not become losses simply because a list needs filling. All supplied points remain available in the full review, so the ranked shortlist is not the complete dataset. An upward change can coexist with an earlier downward change, and the overall shape need not be a one-way departure funnel. Use the dips and spikes guide when a reversal deserves closer inspection. A ranking helps you choose where to look; it cannot establish why a passage changed or what every viewer did there.
Keep exact windows and missing endpoints visible
A review window is available only when both requested boundary timestamps are actual supplied points for that video. If your observations are at ten and twenty seconds, asking for a window from twelve to eighteen does not create two new measurements. The analyzer leaves that window unavailable. It does not interpolate along the connecting line, choose the closest point, or quietly shorten your request. This is especially important when a scene change falls inside a wide sampling gap. You may have an editorial reason to inspect that scene, but the existing numbers cannot quantify a precise before-and-after change at its unseen boundaries.
Coverage records the first supplied time, last supplied time, and point count. Those facts show what the review can actually describe. A sixty-second video whose final observation is at forty seconds has a last observed percentage, but no measured end retention in this project. The tool will not copy that percentage forward to sixty or replace the missing endpoint with zero. Similarly, a series beginning at three seconds has no supplied zero-second baseline. Record the limitation directly in Review notes, and collect additional authorized observations only if the reporting surface makes them available. A shorter honest series is preferable to a complete-looking invented one.
Sparse observations also limit interpretation inside a valid window. A change from 78 to 62 between ten and twenty seconds does not show whether the decline was gradual, concentrated around eleven seconds, or interrupted by an unseen rise. Straight chart segments are visual guides connecting observations, not measured intermediate values. More observations can narrow a question, but manually placing extra rows along an existing line adds no evidence. The Facebook video retention guide applies this caution to transition reviews. If a requested boundary is missing, preserve that missingness in the handoff rather than reporting an exact-looking number derived from the drawing.
Compare timing and averages without combining their meanings
Enable Compare two videos only when a second supplied series serves your question. Give Video B its own duration, label, points, and optional average rather than assuming the first video’s settings apply. Matching platform labels do not guarantee matching audience segments, traffic, collection ages, or retention definitions. Reporting scope should explain those conditions in language another reviewer can understand. If one video was collected after a week and the other after a few hours, the chart does not correct that mismatch. You can still document the difference, but you should not describe the resulting overlay as a fair test merely because both series display successfully.
Chart axis offers Seconds and Video progress. Seconds places observations by elapsed time; Video progress places them relative to each video’s duration. At twenty seconds, a forty-second video is halfway through while an eighty-second video is one quarter through. Changing the axis changes chart position only. It does not normalize retention, generate matching timestamp samples, or alter the exact review window. A window still asks for seconds, so check its boundaries independently in both series. The TikTok video retention guide discusses short-clip context without treating relative progress as a new common audience definition or a repair for incompatible data.
Average watch is an optional value you supply independently. The displayed average percentage is one hundred times average watch divided by duration. For the fictional example, 32 divided by 60 gives approximately 53.33 percent, while 36 divided by 60 gives 60 percent. These ratios do not tell you the percentage at thirty-two or thirty-six seconds, and the tool does not calculate an average from the area beneath sparse chart lines. Different curves can share one average. The Instagram Reels retention guide develops that distinction when a broad average is available but the timing of the payoff remains unknown.
Turn an observed pattern into a cautious editing hypothesis
After locating a notable interval, inspect the corresponding passage in your own playback or editing workflow outside this tool. Note what changes: perhaps the explanation switches camera angle, repeats an already completed step, or introduces a different task. Those are candidate explanations, not facts established by a retention difference. The same interval may include several changes, and the audience composition may differ between videos. Write a hypothesis that names one possible issue and one feasible revision. For example, you might test whether showing the finished assembly before listing materials makes the promise clearer, while leaving the required safety information in place.
Treat rises and percentages above 100 with equal care. Depending on the source definition, repeated viewing or loops can contribute to values above 100, but the number alone does not prove that looping caused it. Check the original measure, denominator, and reporting scope before interpreting an unusual value. Do not cap a legitimate supplied observation at 100 just to create a familiar-looking chart. Conversely, the tool’s accepted ceiling of 1000 percent is an input boundary, not evidence that a platform supports that value or that such retention is desirable. Replaying an unclear instruction could reflect difficulty rather than enthusiasm for the lesson.
Choose a next step that respects the purpose of the video. A technical explanation may need a deliberate pause; a reference tutorial may help people find one chapter without watching everything. The useful question is whether the passage serves its intended viewer, not whether every slope can be flattened. Record what evidence would make you reconsider your hypothesis, including missing points or a changed traffic mix. Keep conversion, satisfaction, and content accuracy in separate evidence streams when those outcomes matter. This analyzer supplies no significance test, causal explanation, winner score, or industry norm, so none should appear in a report merely because its chart looks precise.
Save a complete review and separate analysis from execution
Use Save project to download the editable JSON record, and Open project to return to it later. There is no autosave or account-backed history, so keep a deliberate saved version before closing the page or replacing important work. Any edit invalidates current results; run Analyze retention again before using Copy results, Download CSV, or Download PDF. The review CSV contains the analyzed record and is not the two-column input template. Name your files with a recognizable review round and retain the original collection context separately. A chart detached from its supplied points, reporting scope, and notes is much harder for another editor to evaluate responsibly.
Review every supplied label and note before sharing an export. The PDF includes complete project JSON and review CSV attachments, which may retain Video B even when comparison is disabled. Turning off the comparison does not establish that the saved record is cleared of its information. Local browser processing also does not prevent a downloaded report from disclosing private account references once it is sent elsewhere. Use neutral labels where appropriate and inspect the full project, not just the visible curve. Keep an internal evidence copy separate from any intentionally reduced communication you prepare manually for a client or a wider production meeting.
Once your team approves a next experiment, account operations become a separate job. SMTasker runs supported social automation across nine platforms using Android devices connected to a Windows PC or Mac. Built-in Skye can help prepare supported workspace settings, while MCP offers a permission-controlled route for a compatible external assistant. Those capabilities do not turn this local analyzer into a retention importer, native video editor, or automatic experiment runner. Keep the creative revision, source analytics collection, and interpretation under human review. The handoff should identify one passage, the observed evidence, the proposed change, and when the team will assess another comparable collection.
Use the right reporting context
Platform and editing guides
Choose a platform or a specific retention question. Each guide uses a different example and explains the data it needs.
YouTube Audience Retention
Review a longer tutorial using supplied opening observations, chapter boundaries, and clearly separated editing hypotheses.
Read the guideTikTok Video Retention
Review an 18-second ribbon-folding clip, separate loops from evidence, and keep organic retention distinct from advertising milestones.
Read the guideInstagram Reels Retention
Follow a florist through a 30-second bouquet reveal, with equal watch-time averages, different supplied curves, and an unmeasured ending.
Read the guideFacebook Video Retention
Examine a 72-second community venue clip, match organic reporting conditions, and review a presenter-to-map transition without assigning causality.
Read the guideLinkedIn Video Retention
Review professional demo intervals using supplied points, without turning LinkedIn averages into a fictional retention curve.
Read the guideX Video Retention
Turn compatible X quartile observations into a careful interval review while keeping denominator, placement, and coverage limits visible.
Read the guideVideo Hook Retention
Plan one opening-shot experiment with a chosen review boundary, supplied comparison points, and no automatic winner claim.
Read the guideRetention Dips and Spikes
Separate observed declines and rises from unmeasured movement, replay assumptions, and unsupported explanations of viewer behavior.
Read the guideQuestions about video retention analysis
Can I build a retention curve from average watch alone?
No. An average does not locate viewing changes within a video. Supply at least two actual timestamp percentages for each enabled series; leave unknown points out.
Why are my review window and end retention unavailable?
A window needs actual points at both requested second boundaries. End retention needs an actual point at the declared duration. Nearby points and connecting chart lines do not fill either gap.
Is a fourteen-point drop the same as a fourteen percent loss?
No. The analyzer subtracts retention percentages and reports percentage points. It does not report relative-percent loss or estimate the number of unique people who left.
Can I upload any platform CSV or fetch a video URL?
No. Prepare the exact time_seconds and retention_percent CSV format yourself. The tool has no native export mapping, account connection, URL lookup, or automatic analytics retrieval.
Does retention above 100 prove that viewers looped the video?
No. Repeated viewing or loops can contribute under some definitions, but the value does not identify its cause. Check the source metric, denominator, and reporting scope before interpreting it.
Keep the approved account work consistent
Build the routine around your next video review
Explore SMTasker for supported Android account automation, with Skye and MCP options. Retention collection and video editing remain separate from this analyzer.