Reading Your Results & Statistics
Every tool has Results, Statistics and Summary tabs — how to read what an automation actually did and whether it is healthy.
Every automation tool has the same five tabs — Settings, Sources, Results, Statistics and Summary. You configure a tool in the first two; the last three are where you read what it did. This guide covers those three so you can check any tool’s performance the same way.
Results: the raw record
The Results tab is a line-by-line log of every action the tool took — who it acted on and the outcome. For the Follow tool, for example, each row is a user it followed, with their username, post count and follower numbers.
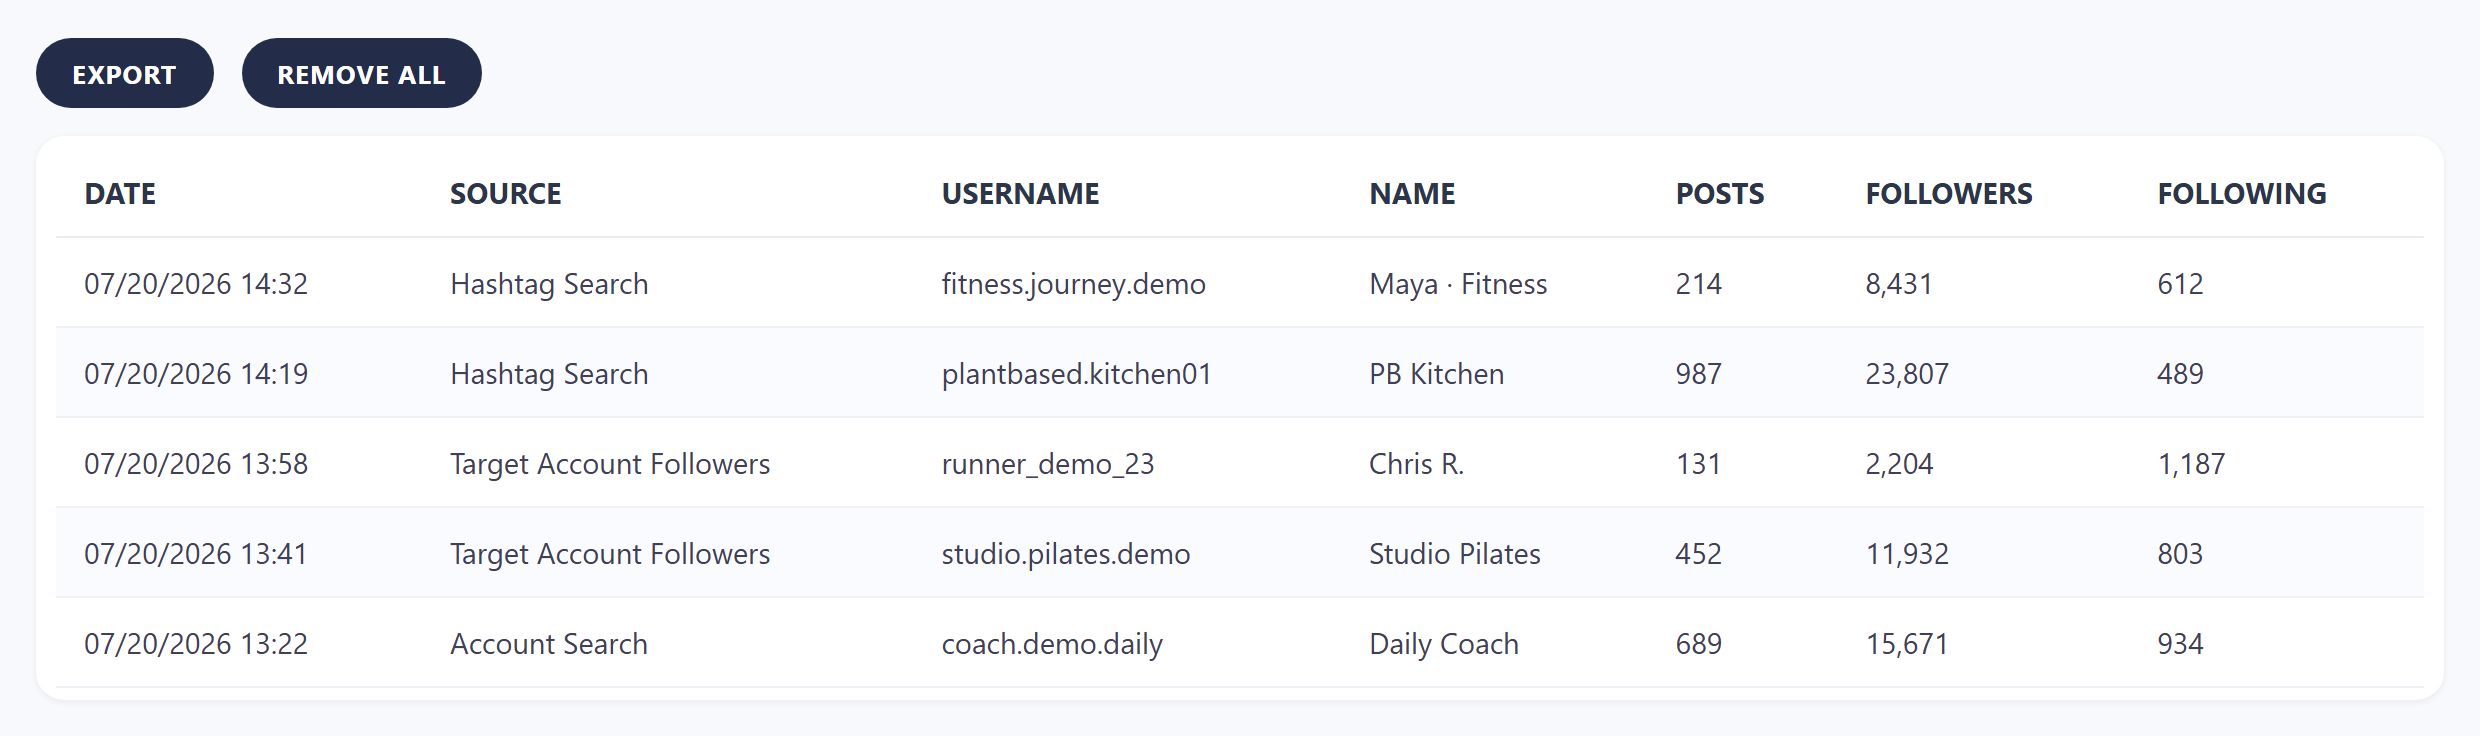
Each row is one action. Use the column filters to dig in, Export to download the data, or Remove All to clear it.
- Export — download the results as a file for your own reporting.
- Remove All — clear the log (this doesn’t undo the actions, just clears the record).
- The column filters (the funnel icons) let you narrow the table — e.g. only rows from one source.
Statistics: the trend over time
The Statistics tab turns those results into a chart of actions per day, so you can see whether the tool is ramping up smoothly or has stalled.
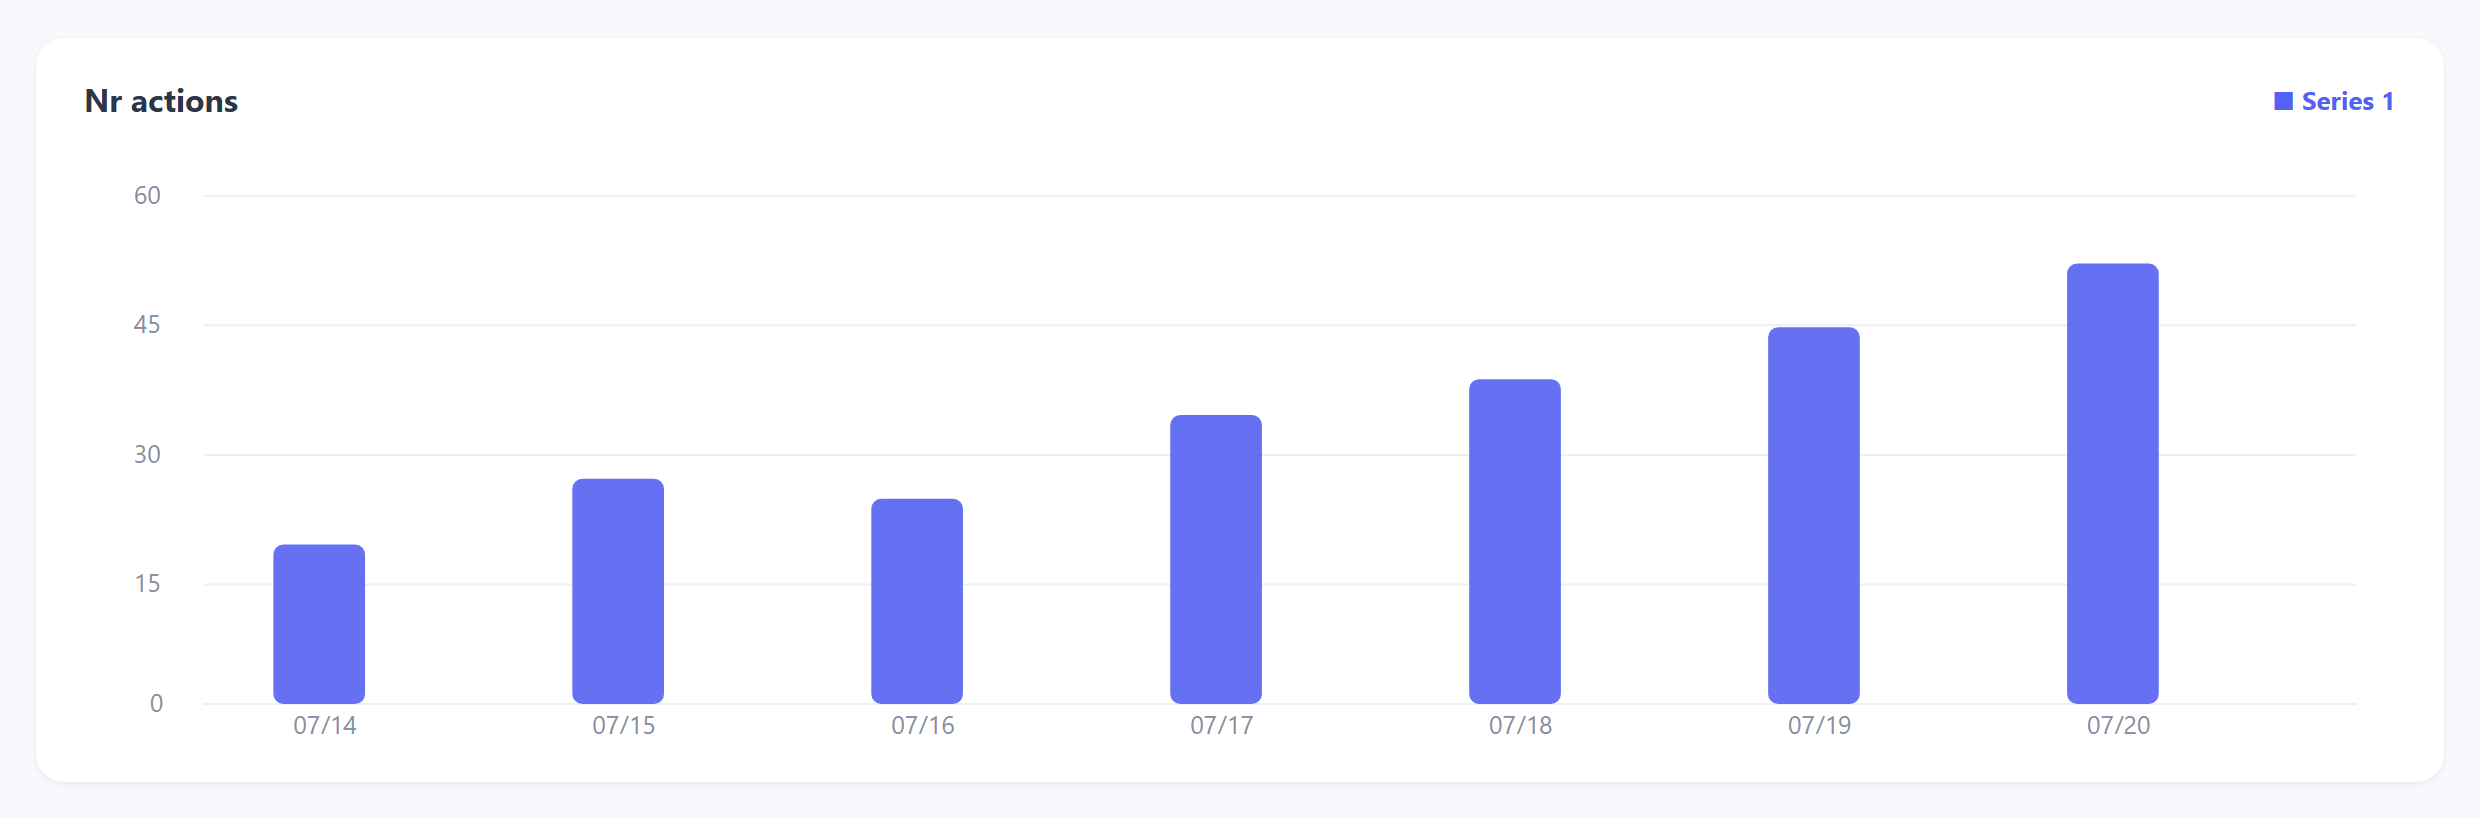
A day-by-day view of how many actions the tool performed — the quickest way to spot a healthy ramp or a sudden drop.
Summary: the run history
The Summary tab logs each run as a whole — when the tool started, how many actions it scheduled and completed, and any issues — so you get the story of the tool over time rather than individual actions.
How to read a tool’s health in 10 seconds
- Statistics climbing steadily? The tool is healthy and warming up correctly.
- Results filling with recent rows? It’s actively working.
- Everything flat / empty? Check the yellow banner and the Settings tab — the tool is almost certainly stopped, offline, or missing a source.