Reading Your Analytics
See how your automations are performing across accounts — global statistics and per-tool performance, with export.
Every action your automations take gets logged — but a log is not a picture. The Analytics page is where thousands of individual follows, likes and views become a trend line you can actually read. Two tabs do the work: Global Statistics and Performance.
The Global Statistics tab
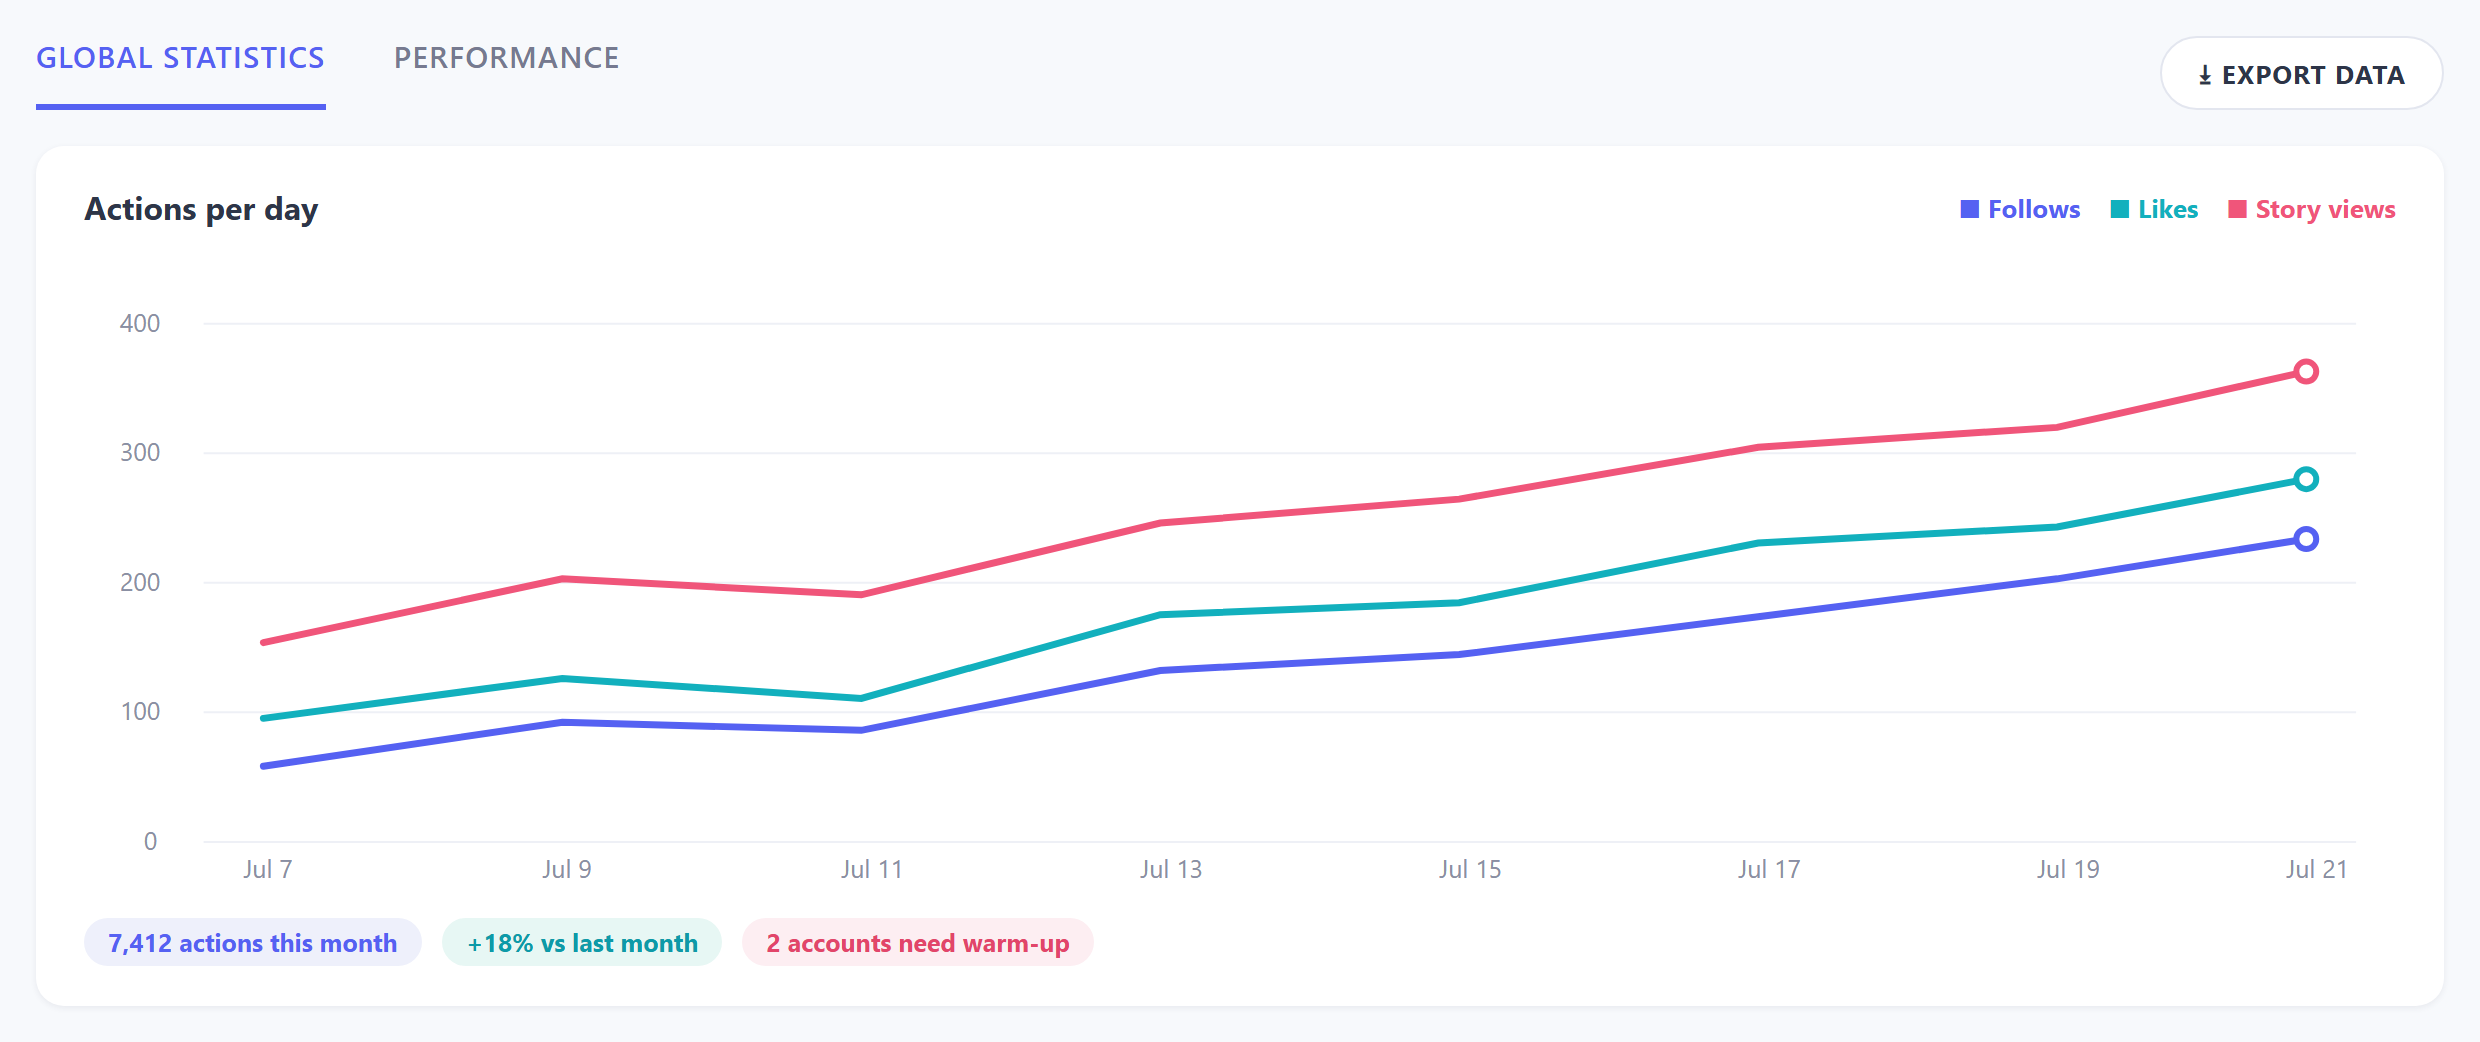
Illustrative example: Global Statistics rolls your action volume across every account into one chart, so trends jump out at a glance.
Global Statistics aggregates activity across all your accounts and devices into one view: how many actions ran, and how the volume moved over time. You’re not reading it for exact numbers — you’re reading it for shape:
- A steady upward slope is what healthy scaling looks like — volumes creeping up as accounts finish their warm-up and limits rise.
- A sudden cliff to zero almost always means hardware, not strategy — a phone went offline or the local client disconnected. Check Home first.
- One flat line while others climb means a specific account stopped — usually a restriction. Check Show Restrictions.
The Performance tab
Performance answers the question Global Statistics can’t: which automations are pulling their weight. It breaks results down per tool and per account, so you can compare — is the Follow tool on your main account outperforming the same tool on account two? Is StoryViewer delivering more profile visits per action than Like?
Use it for pruning: when a tool has run for two weeks with weak results, that’s not a reason to push its limits up — it’s a reason to fix its targeting or reallocate the action budget to a tool that’s working.
Export Data
The Export Data button downloads the raw numbers. Two situations where it earns its place:
- Client reporting — agencies can drop the export into a spreadsheet and chart growth per client account.
- Before big changes — export a baseline before you restructure your tools, so “did it work?” has a real answer two weeks later.
A five-minute weekly review
| What you see | What it usually means | What to do |
|---|---|---|
| Volume trending up smoothly | Warm-up and limit increases on track | Nothing — stay the course |
| Volume dropped to zero | Device offline / client disconnected | Check Devices and reconnect |
| One account flat, rest normal | Restriction or paused account | Check restrictions; rest the account |
| Actions high, results weak | Targeting problem, not volume problem | Rework sources |